Where a hundred billion tokens went
In May I built AI Spend Live because I kept hitting the weekly limits on two coding subscriptions and wanted to see what I was spending them on. It reads the local logs that Claude Code and Codex write on my machine and shows where a week went: which models, which sessions, which single turns were absurd.
This month I asked it a harder question. Where did the whole year go?
The receipts were incomplete
The first answer was a lesson about logs. Claude Code keeps a full transcript of every session, which is where the token counts live, and deletes them after thirty days. My machine had transcripts back to October 15 and nothing older. Codex keeps its transcripts until you clean them up, and mine survive from July 10 only because I moved its data folder to a bigger drive that month. For March through June the only trace is a database of thread totals, one number per conversation, with no detail inside.
Two things survived the whole year. Claude Code keeps a small statistics file with running totals per model, so there is a year-long number even though most of its days are gone. And both tools keep a history of every prompt I have ever typed, with a timestamp and a project folder, which says nothing about tokens and a great deal about what I was doing.
So this is a reconstruction, and I am stating the coverage before the charts, because the alternative is a chart that looks authoritative and is quietly missing March. Prompt counts are complete. Codex tokens are exact from July and lumps before that. Claude tokens are exact from mid October, daily from late August, and a single total for the year.
The tool was wrong
The second answer was worse. Once the export existed I could compare it against the statistics file and against the raw transcripts, and the three did not agree.
Claude Code writes one record per content block of a reply: a paragraph of text is one record, a tool call is another, and every record repeats the full token usage of the message. My dashboard had been counting each record. So had, as far as I can tell, the statistics file: on every day where I have both, it matches the raw sum of records exactly and runs about 2.1 times the count you get after collapsing records by message. The dashboard had also been adding cache writes twice, because the detailed cache fields are already summed into the total it was adding them to.
Codex had a different problem. When a session forks a sub-thread, the child’s transcript replays the parent’s entire event stream, token counts included, with fresh timestamps. The dashboard counted the replay. Fourteen billion tokens of this year’s Codex total were echoes.
Both bugs are fixed in the 0.5 release, and the numbers below use the corrected parsers. I had been looking at a dashboard that was wrong by roughly half for six months and acting on it, and the decisions it drove were still right: split the long session, start a new one when the task changes, stop forking agents casually. The ratios were right even when the totals were not. I would still rather have had the totals. I wrote up the ledger and the fixes separately.
The shape of the year
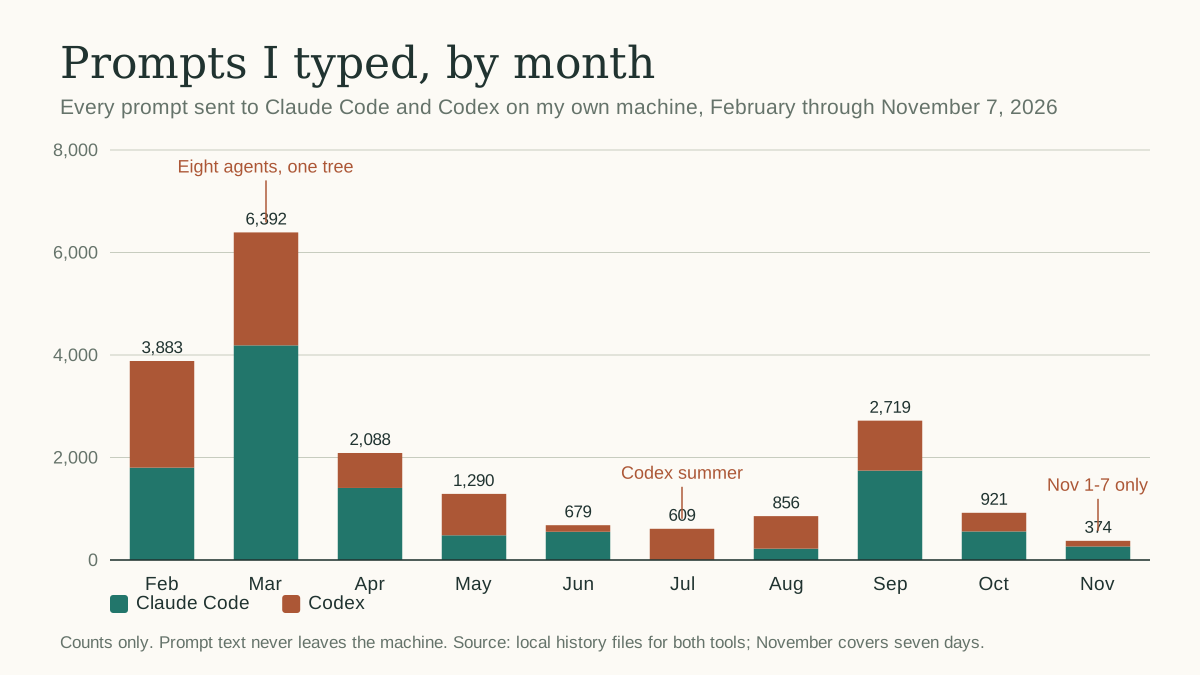
Between February 8 and November 7 I typed 19,811 prompts into the two tools on my own machine: 11,218 to Claude Code and 8,593 to Codex, across 1,241 sessions. Nine out of ten Claude prompts went to one project, my game, All Is Vanity. The rest went to the small games, the website, the comic maker, and the dashboard itself.
The shape is not a hockey stick. It is two mountains with a valley between them.
February and March are the first mountain: 3,883 prompts, then 6,392. That is the period I wrote about at the time, when I ran eight agents in one tree and spent a day finding a null check. The prompt volume was itself the symptom. Eight agents means eight conversations to feed, and every “fix the thing you just broke” is a prompt.
The valley runs from May to August. Some of that is life. Some of it is the May dashboard showing me that one session had eaten 44 percent of a week, which made me more deliberate about starting sessions at all. July is the strangest month on the chart: 609 prompts, and only three of them to Claude. I had let the Claude subscription lapse for a stretch that summer to see what going all in on one tool felt like, and it was a slower month besides. I had half forgotten both facts until the history file reminded me.
September is the second mountain, 2,719 prompts, and a different shape of work: fewer sessions, longer ones, more of the typing done by agents inside them. Since then the prompt count has fallen every month while the token count has not. That gap is the rest of this post.
Fewer prompts, more tokens
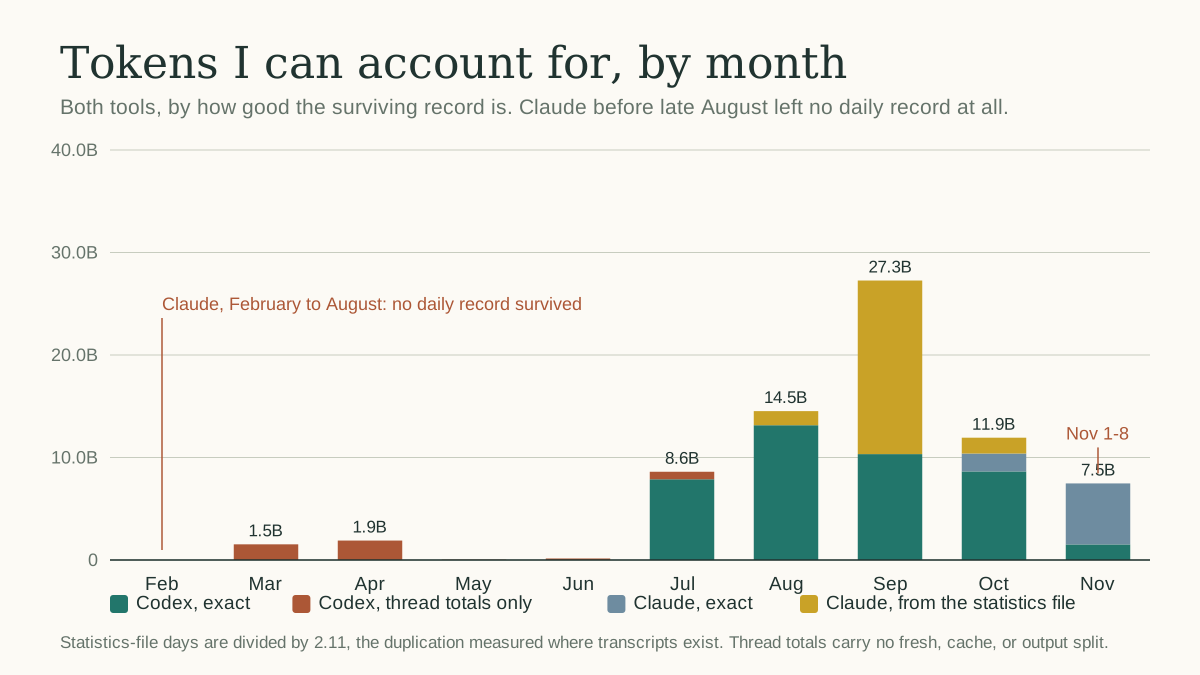
Here is what the corrected ledger can account for. Codex: 45.9 billion tokens from March to November, 41.5 billion of them exact and the rest thread totals. Claude: 7.7 billion exact since October 15, about 20 billion more estimated from the statistics file for the days it kept between late August and mid October, and a corrected year total of about 47 billion. Between the two tools the year is a little over 90 billion tokens that I can count, and the true number is higher by whatever Claude burned between February and August, which no surviving file records by day.
The biggest month I can see is September, at about 27 billion across both tools, almost two thirds of it Claude. That is the month the prompt chart shows falling from its March peak. Prompts down by more than half, tokens at the year’s high. The agents were running longer between my instructions, and in the next post I try to say what they produced.
Then the cache. Of every prompt-side token in the corrected ledger, 97.1 percent was a cache read: the model re-reading the conversation so far. Claude was 98.6 percent, Codex 96.9. Fresh input, the part I typed or pasted or the tools read from disk for the first time, was a rounding error. Output, the part that is new text from a model, was well under one percent.
Read those numbers together and the economics of agentic coding fall out. Almost nothing I spend is the model thinking. Almost all of it is the model remembering. A conversation that has run for three hours pays for its entire history on every turn, which is why the dashboard’s oldest advice is still its best: when the task changes, start a new session and put the durable context in a file.
Which models
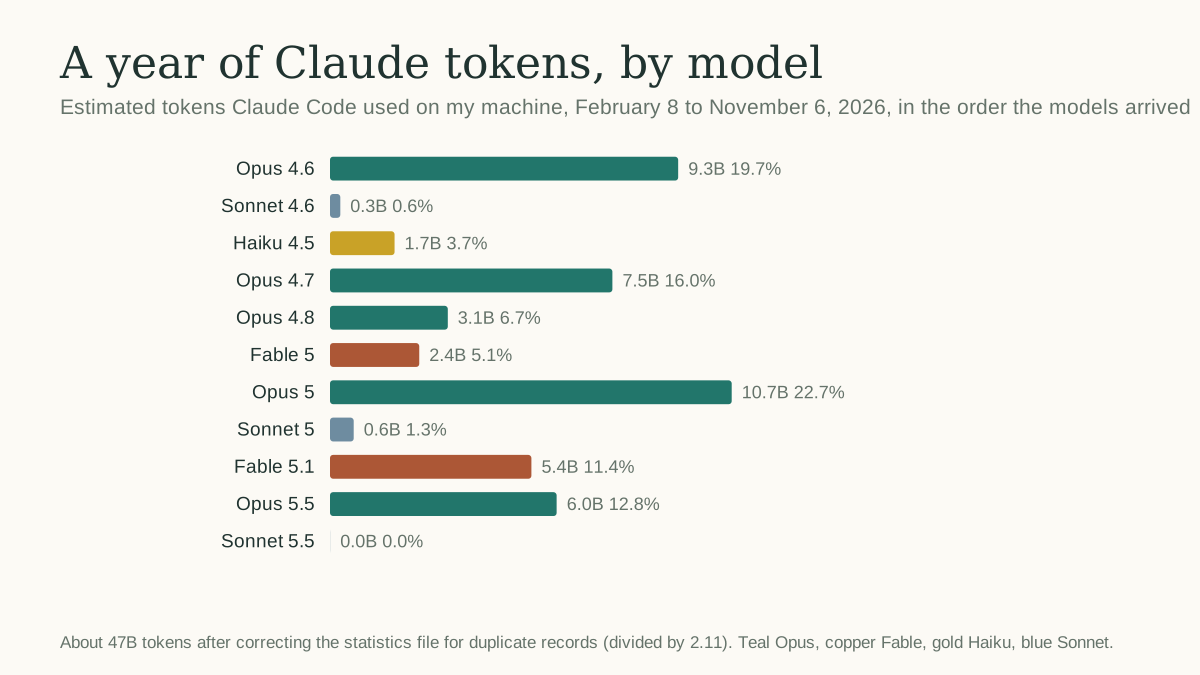
Claude Code on this machine used eleven model versions this year. By family, 78 percent of the tokens went to Opus, 16.5 percent to Fable, 3.7 percent to Haiku, and 1.9 percent to Sonnet. The generations march across the chart in order: Opus 4.6 in February, 4.7 and 4.8 through the summer, Fable 5 and Opus 5 from late August, Fable 5.1 and Opus 5.5 since October. I upgraded on schedule and the mix barely moved. The biggest available model does the work; a smaller one gets the typing when the brief is tight.
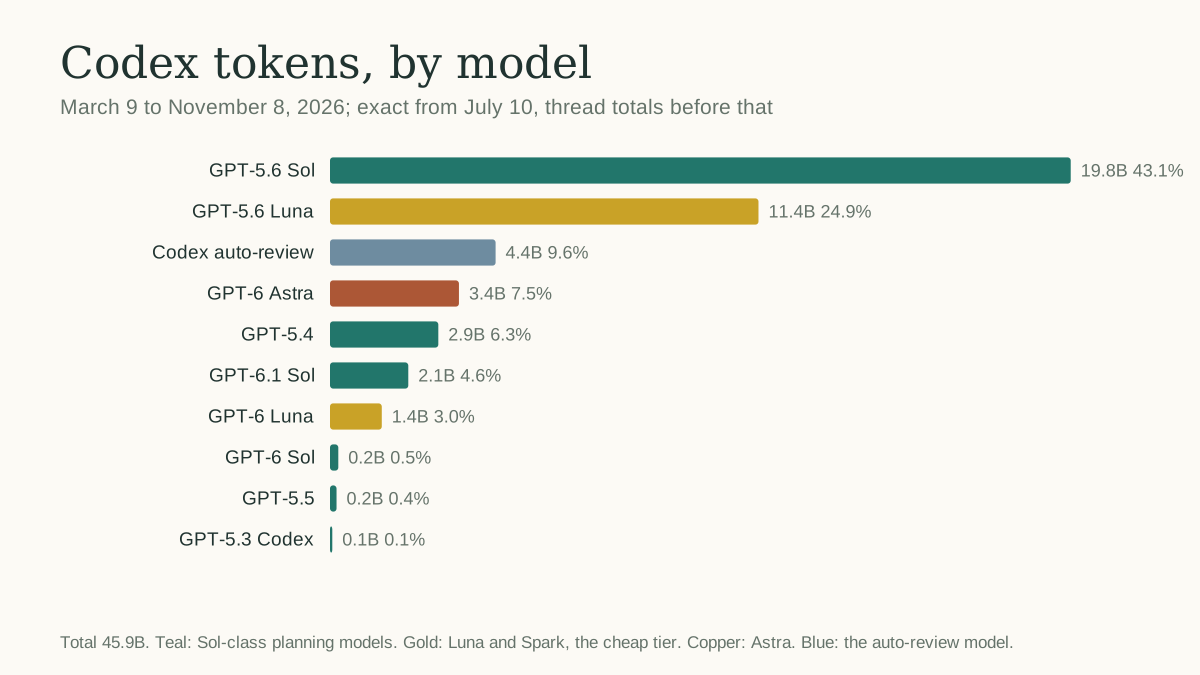
Codex tells a slightly different story. GPT-5.6 Sol took 43 percent of the Codex tokens and Luna, the cheap tier, took 25 percent, which is the budget-airline experiment from September showing up in the data: nearly a third of Codex volume went to models I chose for price. Then there is a model I never chose at all. The automatic reviewer that reads every Codex change consumed 4.4 billion tokens, almost ten percent of the total, at the lowest reasoning setting. Half of all Codex tokens ran at the highest reasoning effort short of ultra, and another 2.7 billion at ultra. When I ask Codex to think, I apparently ask it to think hard.
The one visible Claude experiment is September, when Sonnet 5 appears for a few weeks, takes a little over half a billion tokens, and stops. That was the cheap-models month. It lasted two weeks. The chart agrees.
Where the tokens concentrate
The ledger’s largest single turns are all from one day, November 7, and they all look the same: a subagent with about 965,000 tokens of conversation behind it, re-reading all of it to say a sentence. Two tokens of fresh input, 965,000 cache reads, 169 tokens of output. At list prices that is twenty cents per sentence, and it was not the only subagent talking that day.
That is the mechanism behind the most surprising number in the year. Since mid October, 87 percent of my Claude tokens ran inside subagents rather than the main conversation, and 54 percent of Codex tokens ran in spawned or reviewer threads. I use the main session to plan and judge, and I hand implementation to agents that each build their own context. It is the right division of labor and it is also where the money goes. Every subagent is a new conversation that has to be paid for on every turn, and a subagent I fork with the full parent context starts life at the parent’s weight.
The sessions tell the same story. One Codex session opened on October 5 and stayed open for seventeen days and 10,100 turns, 1.76 billion tokens. One Claude session has been open for 23 days as I write this. I know better. The dashboard told me in May. Stopping is never as expensive as it feels, because the context has to be rebuilt either way; the only question is whether it is rebuilt once, deliberately, in a file, or on every turn, by accident, from cache.
What it would have cost
At published API list prices, the corrected Claude year is about $30,000 of API-equivalent spend, and the priced part of Codex from July to November is about $16,700. Call the countable year $47,000 and the real year somewhat more. I paid for it with two consumer subscriptions at a few hundred dollars a month each, roughly $4,000 over the year, give or take the lapsed month.
I want to be careful about what that ratio means. It does not mean I got $47,000 of compute for the price of a gym membership. Cache reads are cheap for the provider by design, which is why they are priced at a tenth of fresh input, and API-equivalent is a fiction for a subscription user. The honest reading is that the plans assume most people do not do this, and the weekly limit is the real price. I hit it in two and a half days in February and I have kept hitting it. The dashboard exists because the limit, not the dollar figure, is the thing I am actually managing.
What the logs can and cannot tell me
| Can it answer? | Notes | |
|---|---|---|
| Where the tokens went by model | 👍👍 | Exact where logs survive, totals where they do not |
| What a prompt cost | 👍 | The turn, yes. The conversation behind it is the real cost |
| Which project ate the budget | 👍👍 | One project, overwhelmingly, on both tools |
| Whether the dashboard was right | 😒 | Not until I had something to check it against |
| Whether it was worth it | ❌ | Not from this side of the ledger |
The last row is the point. Tokens are an input. The next post looks at the other side: what the year actually produced, and which measures I trust for that.
Counts in this post come from local log files on one machine, parsed by AI Spend Live 0.5 with the fixes described above, and from the two tools’ own statistics and history files. They cover my personal projects only. No prompt text was read to produce them. The evidence page lists every source, its coverage, and the corrections applied.