What the tokens bought
The previous post counted the input: a hundred billion Claude tokens, a summer of Codex, twenty thousand prompts. This one counts what came out, and then argues with the counting.
At work I have watched pull requests per engineer turn into a hockey stick this year. I do not trust that chart, because agents make pull requests cheap and the chart cannot tell cheap from valuable. My personal projects give me the same chart in a different unit, and the advantage of personal projects is that I can open every repository and check what the number was made of.
The raw count
Between February 8 and November 7, I made 3,496 commits across 21 repositories, on 164 of the 273 days. The longest streak was 42 days, from the first Saturday in February to March 21. January had zero commits. The year did not start; it detonated, on one weekend, when I pointed Claude Code at a folder of old projects.
Git says those commits added 8.4 million lines. That number is true and useless, and it is worth spending a paragraph on why, because the same failure hides inside every productivity chart I have seen this year.
Fifty-nine commits, 1.7 percent of the total, carry 71 percent of the added lines. They are imports and data dumps: a 1.46 million-line import of my 2010s website before the rebuild deleted it again, a 786,000-line export of animation data for the artist, a 244,000-line comic-maker rebuild landing in one commit, model files for a Roblox prototype. None of that is typing, mine or the agents’. Strip out every commit of 20,000 lines or more and the year is 2.16 million lines added and 485,000 removed, across 3,437 commits. Those are the numbers in the charts below, and even they include tool reports, JSON, and generated metadata that the filter does not catch. The method lists exactly what was excluded.
Where the work went
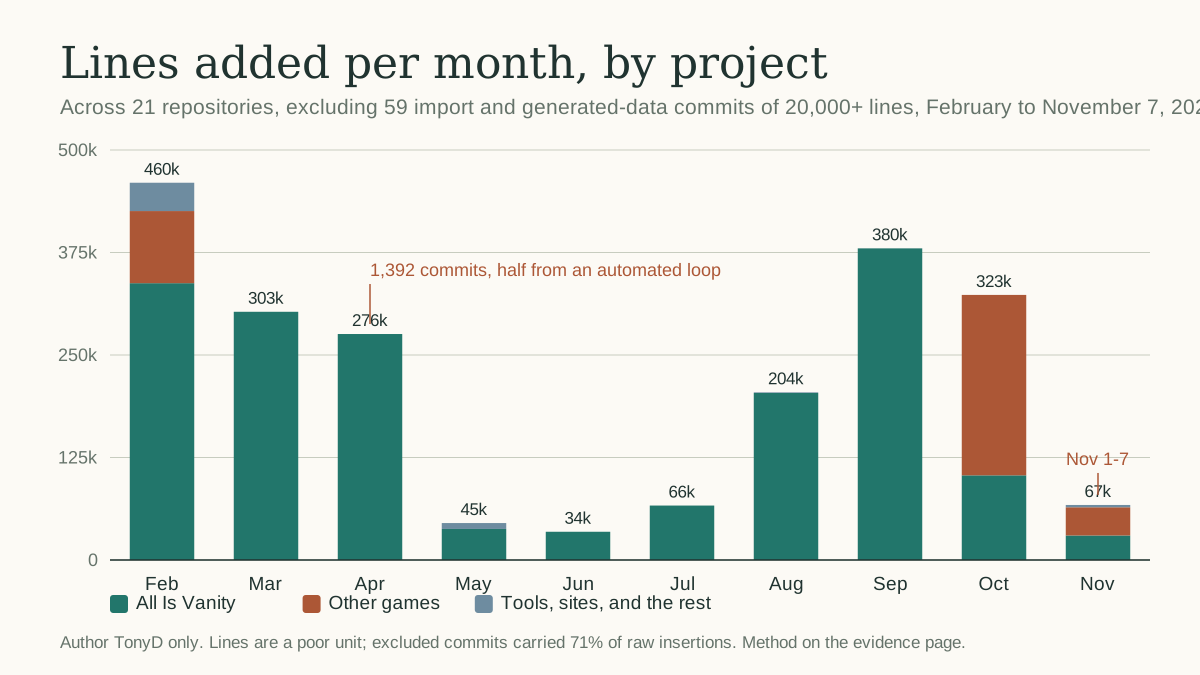
Two thirds of the surviving lines went to one project. All Is Vanity, the game that had been asleep since 2020, took 2,234 commits and 1.47 million filtered lines, plus 164,000 in its assets repository. An experimental Godot port of the same game took another 125,000 lines between February and April before I stopped it. Everything else on the projects page is small by comparison: Space Taxi 41,000 lines, the Roblox prototype 232,000 (mostly generated model files), the street brawler 16,000, the comic maker 16,000 outside its one big rebuild commit, the wagon game 11,000, the ski game 10,000, the dashboard 6,500.
The monthly shape matches the prompt chart from the last post, with one difference. Prompts peaked in March. Lines peaked in February and again in September, and the September peak came with far fewer prompts. That gap is the most interesting number I found, so it gets its own chart.
The leash got longer
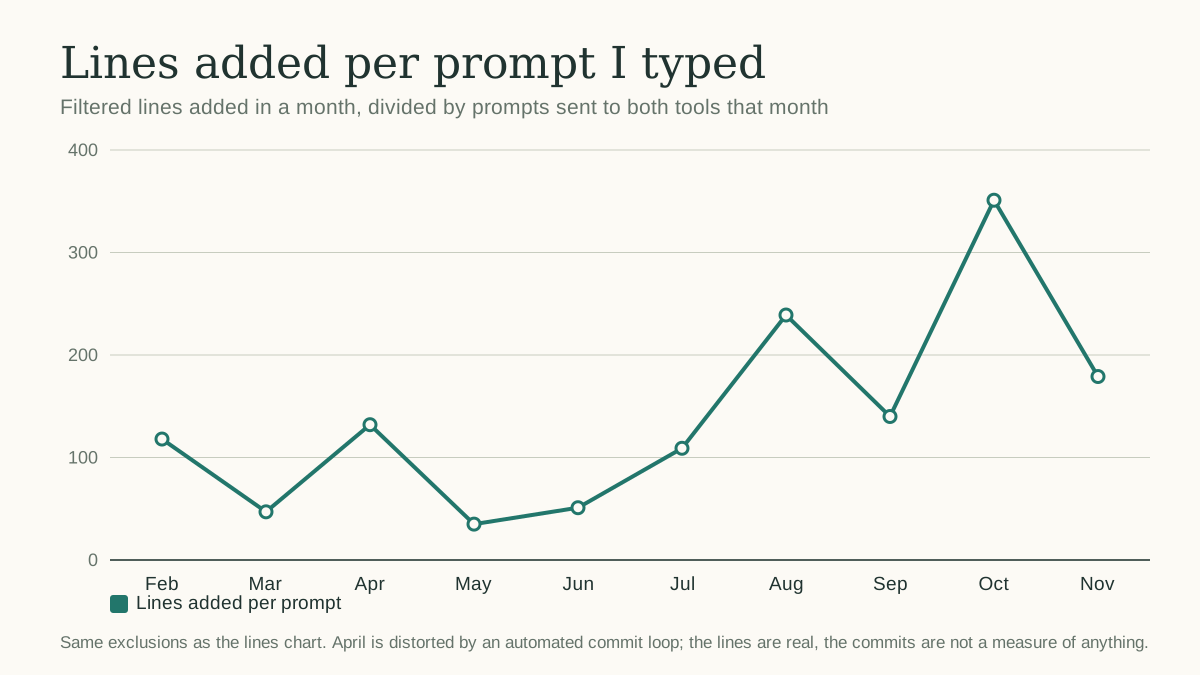
Divide a month’s filtered lines by the prompts I typed that month and you get a rough measure of how much work one instruction buys. In the spring it was 84 lines per prompt. In the autumn it was 202, two and a half times as much. October was 351.
I do not think the models got two and a half times better between March and October, although they got better. What changed is what I was asking for and what the agents could check for themselves. The tools directory of the game now holds about 700 scripts whose names include harness, smoke, audit, or regression, and more than three quarters of them appeared in August and September. An agent that can run a harness can keep working after I have gone to bed. An agent that needs me to playtest every change gets a prompt every twenty minutes, and the prompt count goes up while the output does not.
The token ledger only reaches back to July, so I can price the autumn but not the spring. From August through October the two tools burned about 54 billion tokens for 908,000 filtered lines added: roughly 59,000 tokens per line, or 65,000 per line that survived two weeks. Ninety-seven percent of those tokens were cache reads. At API list prices that is about three cents per surviving line. At what I actually paid for the subscriptions, it is about a tenth of a cent. Neither number is the cost of software; both are the cost of lines, and lines are what I have just finished arguing are the wrong unit.
So the hockey stick I would draw for my own year is not lines and not prompts. It is lines per prompt, and it says the leash got longer because the checks got better. That is a claim I can defend, which is more than I can say for the PR chart.
What got thrown away
Speed that produces rework is not speed. The best proxy I could compute from Git is churn: of the lines added to the game in a given week, how many were deleted from the same file within the following two weeks. The answer for the year is 8.8 percent, or 9.6 percent after excluding the mass commits. Roughly one line in ten did not survive a fortnight.
I expected worse. I also do not know what a good number is, because I have never measured it for a human-only codebase, and I suspect nobody on my teams has either. It is on the list for next year, and it is the first thing I would add to any team dashboard that currently shows pull requests: not how much was merged, but how much of last month’s merges are still there.
What actually shipped
Here is the honest ledger of things a stranger can use, as of this week.
- Eight browser games on the projects page: five ports and rebuilds from February, and three newer ones that got real version numbers for the first time this week, when I finally built a release workflow for them.
- A comic maker from 2008, rebuilt and back online at taketoon.com.
- A usage dashboard, released at 0.1 in May and 0.4.1 this week, which produced the numbers in these posts.
- About sixty blog posts, including these.
- Zero public releases of the game that took two thirds of the work.
That last line is the one that matters, and it is why I distrust activity charts. By commits, lines, or tokens, the game is the overwhelming output of the year. By the only measure a player cares about, it has shipped nothing yet. The year’s work on it is real: a boss system driven entirely by data, a level editor with thirteen room types, an overworld for ten worlds, a trailer pipeline, and the 700 harnesses. It is also, so far, inventory. The release tags tell the same story. Across 21 repositories there was not one release tag all year until this week, only three safety markers before risky merges.
The measures I would keep
If I had to replace the pull-request chart with five numbers for my own work, they would be these, and the first three are ones I could compute from a team’s repositories tomorrow.
| Measure | This year | Why I trust it more than PR count |
|---|---|---|
| Lines per prompt (or per ticket) | 84 → 202, spring to autumn | Measures how much one human instruction buys; rises when verification improves |
| Two-week churn | 8.8% of added lines | Rework shows up as deletions, not as speed |
| Shipped versions a user can open | 3 games versioned this week; 1 tool at 0.4.1; game at 0 | The only count the customer can see |
| Active days | 164 of 273 | Consistency is cheaper than heroics and predicts more |
| Tokens per surviving line | about 65,000, Aug to Oct | Cost of the line that is still there in two weeks, not the line that was typed |
None of these is a productivity multiplier, and I am not going to multiply them into one. They are the questions I would want answered before believing any chart that goes up and to the right, including mine.
Counts are from Git history across my personal repositories, author-filtered, deduplicated across rewritten history, with the exclusions described on the evidence page. They describe my independent projects, not employer results.