A ledger that outlives the logs
AI Spend Live is a small local dashboard I released in May. It reads the usage records that Claude Code and Codex leave on your machine and tells you what a week cost: which models, which sessions, which turns, how fast you are burning toward the weekly limit. It is open source and runs on your own disk; nothing leaves the machine.
It had one design flaw I did not notice until I wanted a year instead of a week. It only ever read what was still on disk. Claude Code deletes transcripts after thirty days. Codex keeps them until you move or clean the folder. A dashboard with that dependency has a memory exactly as long as the tools underneath it, and when I asked it about February it had nothing to say. Version 0.5 fixes that, and in the course of fixing it I found it had been wrong about the present too.
The ledger
The new command walks every local record for both tools and writes a ledger: one row per day, provider, model, and project, with fresh input, cache reads, cache writes, output, turns, sessions touched, subagent share, reasoning-effort buckets where the tool records them, and an API-equivalent cost that is null rather than zero when a model has no configured price.
1
npm run history:export -- --out D:\aispend\ledger.json --summary-out D:\aispend\summary.md
The important part is the merge. If the ledger already exists, each row is merged by its key and every token field takes the larger of the old and new values. Re-running on the same logs changes nothing. Running after the logs have been pruned keeps the rows the logs can no longer produce. Running after a bigger scan takes the bigger number. The previous ledger is kept as a backup and the write is atomic, so a crash mid-export cannot leave you with half a history.
The ledger also carries a coverage block, which is the part I wish every chart came with: the first and last record per source, and the explicit ranges of days with nothing in them. My own reads: Claude exact from October 15, Codex exact from July 10, Codex thread totals back to March 9, and a list of gaps. When the summary says September was my biggest month, the coverage block is what lets me say that honestly.
Nothing in the ledger identifies a conversation. Session ids are hashed, project names are folder names, and a Codex working directory that happens to read like a prompt is replaced with a generated label. There is no prompt text, no title, no path beyond the roots that were scanned. I built it so the file could be shared without a second thought.
Run it weekly, on a schedule, before the logs age out. If you want the raw transcripts to live longer as well, Claude Code has a cleanupPeriodDays setting; I left mine at the default and let the ledger do the remembering, because 2.3 gigabytes of transcripts for three weeks is a real cost on a small drive.
What the first run found
A ledger is only useful if you can check it against something, and for the first time I had three sources for the same weeks: the raw transcripts, the dashboard’s totals, and Claude Code’s own statistics file. They did not agree, and the disagreements were all bugs.
Claude Code writes one record per content block. A reply with a paragraph of text and a tool call is two records in the transcript, and both repeat the message’s full usage. The dashboard counted both. The fix is to collapse records by message id and keep the largest value of each field, since later records carry the final output count. On today’s transcripts that removed 26,445 duplicate records and cut the Claude total from 16.4 billion tokens to 7.7 billion. The statistics file that Claude Code keeps appears to count the same way; on the days where both records are complete, it matches the raw sum exactly.
Cache writes were counted twice. The usage record carries a cache-write total and a breakdown of that total by cache lifetime. The dashboard added both. That halved the cache-write figure once corrected.
Codex forks replay their parents. When Codex spawns a sub-thread, the child’s transcript begins with a replay of the parent’s events, including every token count, stamped with fresh timestamps milliseconds apart. The dashboard counted the replay as new usage. Across the year that was 93,205 replayed events and fourteen billion phantom tokens, which took July from 22.7 billion down to 8.6. The fix keys each cumulative snapshot to its root session and skips the echoes. A related bug let the replayed metadata overwrite the child’s identity, which collapsed children into parents and then recovered the same threads again from the SQLite database as lump totals.
Two smaller things: repeated snapshots with identical cumulative totals are now skipped, and Codex reasoning effort and sub-thread flags, which the dashboard had never read because they live in different fields than I assumed, are now captured. The effort numbers were worth having. Half my Codex tokens ran at the second-highest reasoning setting.
The dashboard’s live view uses the same corrected parsers, so its numbers dropped by roughly half for Claude and lost the fork echoes for Codex. The ratios it had been showing were right all along: the long session was still the long session, the biggest turn was still the biggest turn. The totals were not, and I had been quoting them.
What it costs to run
The Claude side is quick: 134 transcript files, 2.3 gigabytes, fifteen seconds. The Codex side is the heavy one. My rollouts are 53 gigabytes, including one seven-gigabyte file from a session that would not die, and the export streams through all of it in under four minutes at about 230 megabytes a second with a peak of 1.2 gigabytes of memory, most of which is the set of cumulative signatures it uses to spot replays. There are --since, --until, and --provider flags for running it in pieces, but a single pass was fast enough that I did not need them.
What I would add next
The ledger answers where the tokens went. It does not answer what they bought, and I spent the previous post computing that by hand from Git. The obvious next step is to let the dashboard read the repositories too: commits and filtered lines per day next to tokens per day, so that lines per prompt, tokens per surviving line, and two-week churn show up on the same screen as the burn chart. The pieces exist; the join does not, yet.
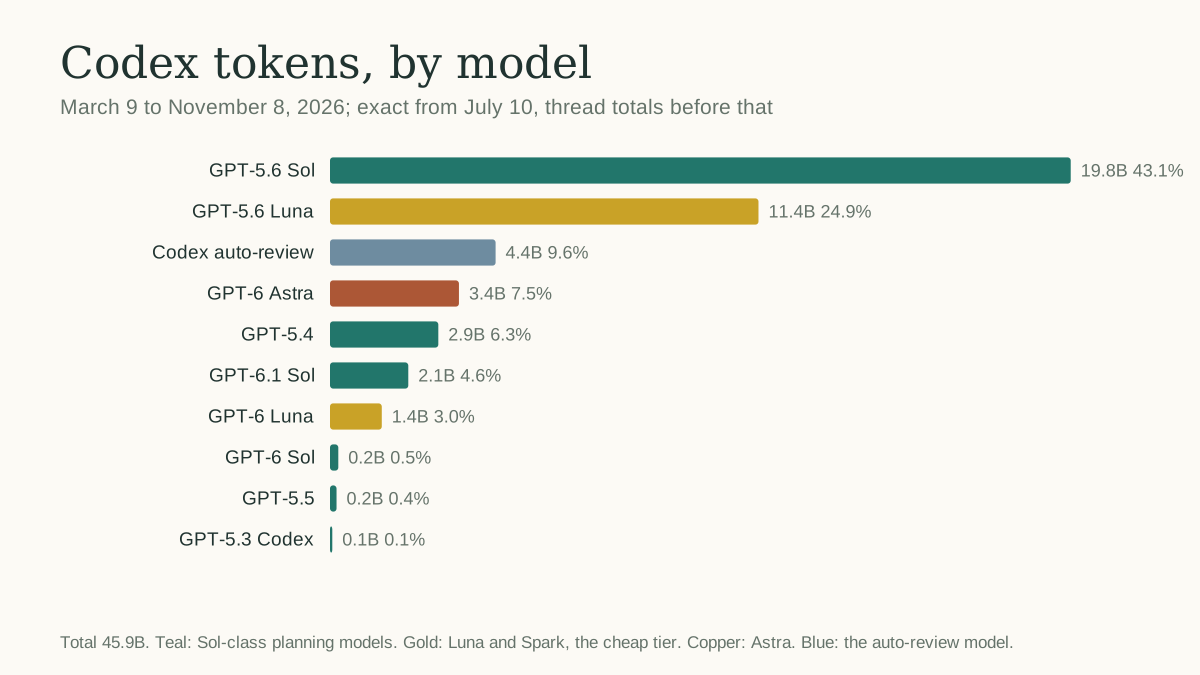
The other addition is a chart I want for myself: tokens by model over the whole ledger, stacked by month, the one that would have shown me in real time that a third of my Codex volume had drifted to the cheap tier in September and that one reviewer model was quietly eating ten percent of the budget. The data is in the file now. The chart is a weekend.
AI Spend Live is MIT licensed. The export, the parser fixes, and the tests are in the repository; the ledger format is documented in the README. The ledger from my own machine, aggregated as described, is the source for the numbers in this series.